Headless Analytics and the Case Against Monolithic BI Tools
Decoupled metrics backends let teams share one definition across dashboards, code, and AI agents.

For API-first and agent-first teams, headless analytics means a governed metrics backend that code can query without depending on a dashboard UI. The case against monolithic BI is architectural. When metric definitions live in a presentation tool, each new consumer may read the business a different way, while a metrics layer that stands on its own gives them all the same analytical contract.
Why monolithic BI tools create a structural consistency problem, not just a usability one
Revenue in Tableau, revenue in Power BI, and revenue in a Python notebook can mean three definitions, none of them matching. Each calculation may look reasonable in isolation, yet there is no shared definition that requires them to agree. If a new exclusion rule changes the formula, someone must update it in every place it is used. A missed update leaves reports silently disagreeing. The familiar metrics review then becomes an exercise in reconciling logic.
This is a consequence of how traditional BI combines business logic and presentation. Metrics are defined inside the tool, assembled into dashboards there, and consumed through its interface. Finance can count active customers by paid transactions, Product by daily logins, and Marketing by email opens, while all three reports appear to describe the same thing. Those definitions may answer different useful questions, but presenting them as one measure makes the disagreement structural.
How vendor lock-in and per-seat pricing compound the architectural problem at scale
Once business logic lives in a proprietary tool format, changing the visualization layer also becomes a modeling problem. The data model does not simply migrate with the decision to use another interface. This locks teams into the tool even when their contract lets them leave. Moving to another monolithic tool can leave a team just as dependent on the new tool.
The same coupling becomes expensive when analytics moves beyond an internal audience. Per-seat pricing scales with the number of people granted access. For a B2B SaaS company embedding analytics, more customers can therefore mean higher licensing costs. Embedding also exposes limits in customization, white-label control, and clean per-tenant data isolation. An embedding feature does not by itself resolve those architectural and economic constraints.
With a decoupled layer, every consumer no longer needs a seat in the same presentation tool. Humans, applications, and agents can use shared metrics through standard interfaces instead. That separation creates a different delivery model, but it does not establish a particular vendor’s pricing.
What headless analytics actually means as an architecture, not a marketing term
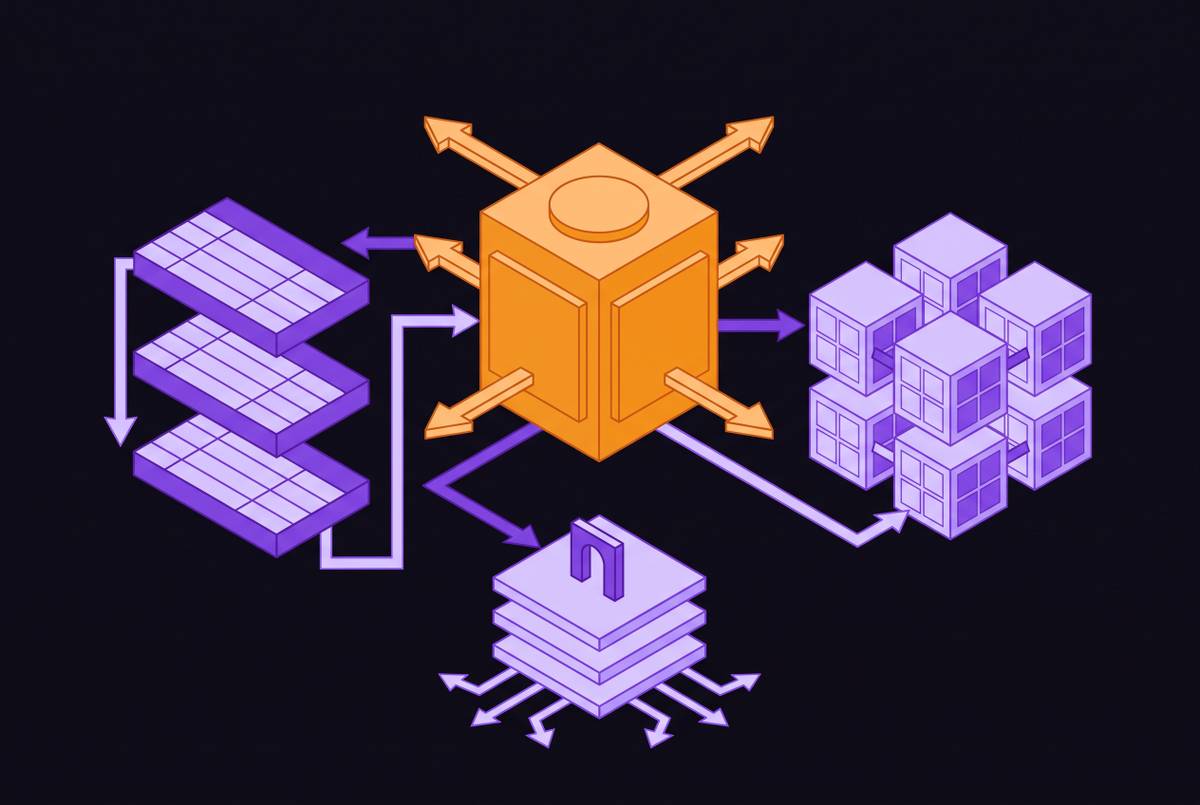
Headless analytics separates the metrics backend from the surfaces that display or use its results. The pattern follows headless CMS and headless commerce, where a backend serves independent frontends. Its defining property is the ability to replace or add a presentation surface without rebuilding business logic.
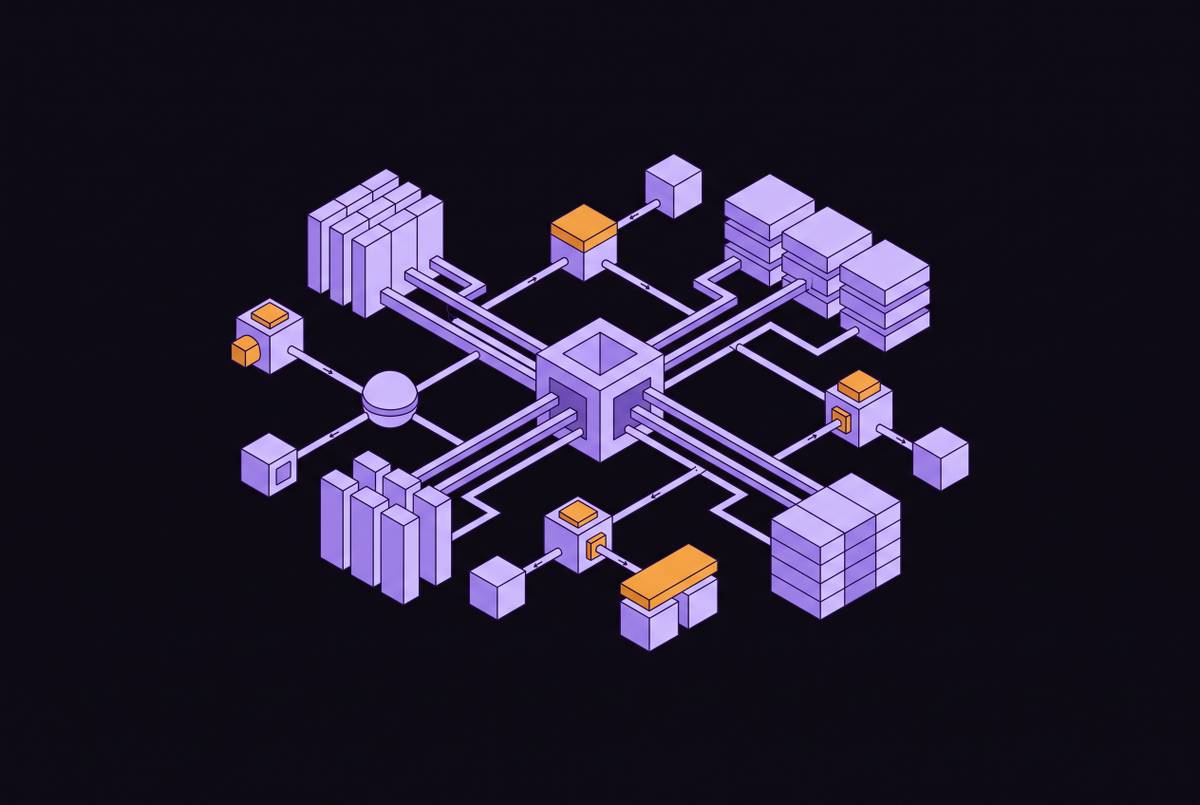
The architecture has three layers: the data layer, the headless analytics layer, and the presentation layer. The data comes from databases, warehouses, and production systems. The reusable analytics layer holds semantic definitions, metric logic, query generation, caching, and access control. Dashboards, embedded applications, Slack bots, mobile interfaces, and AI agents consume that layer independently. An endpoint that returns chart data is not equivalent to this separation.
The semantic layer is the heart of the architecture, translating raw schemas into business-friendly metrics and dimensions and centralizing definitions in configuration such as YAML or JSON. Headless analytics lets consumers use those definitions through a service that stands on its own and has the controls needed to serve them all. Mixpanel also uses headless analytics to mean programmatic access to its analytics engine, so code can run analyses and get structured results back. That is a related use of the term, so evaluation must distinguish access to an existing engine from an independently reusable metrics backend.
Why AI agents make headless analytics necessary rather than merely convenient
For a human reader, a dashboard can be the final destination of an analysis. For an agent, the result is often an input to another action. The agent needs to submit a query, have business concepts resolved by the modeling layer, and receive governed results it can use in code. A visual interface alone cannot give the agent all of that.
Programmatic access enables scheduled analysis, threshold alerts, workflows triggered by analytical results, and multi-step investigations. It also lets an analysis combine metrics with CRM or financial data. These workflows make the location of business logic an immediate design constraint. If an agent cannot reach the canonical definition, it must either remain outside the workflow or reconstruct the calculation elsewhere.
Direct database access may look like a shortcut around that limitation. It gives the agent tables to query, but tables do not necessarily encode the business definitions that a team has agreed to use. The shortcut also puts the work of running analytics on production resources. The architecture must therefore control what the agent may read, what it may execute, and which definitions it must obey.
The production database access problem and why agents need a governed layer in between
An agent that constructs arbitrary SQL can operate outside protections historically enforced by application code. Queries that have been tampered with may reveal sensitive data or change protected records if permissions allow it. Dynamically generated SQL also cannot be practically reviewed and tested in the same way as a fixed application query. Even with read access alone, queries can still be costly and calculations can still disagree.
For Supabase teams, limits on performance matter as much as limits on what an agent is allowed to do. A Supabase instance is row-oriented and tuned for transactional work. Analytical scans and aggregations compete with live traffic for CPU and memory. Supabase recommends using a read replica for complex analytical queries and reserving the primary for user-facing operations. That separates workloads, but a replica alone does not supply approved metric definitions.
The safer pattern is a governed query tool that accepts only a metric name, filters, and dimensions. The agent retrieves a metric contract, asks for allowed dimensions, and receives results with provenance. The advice is to start with read-only resource servers and add write actions later under change approvals. The implementation must also address semantic bypass, many small calls that compound in cost, and the need for durable traces when servers are stateless. Dreambase implements this separation with pre-modeled, governed Parquet datasets queried through DuckDB and exposed through a single MCP server, keeping agent queries off production Postgres.
How MCP standardizes the interface between agents and governed data layers
Anthropic introduced MCP in November 2024 as an open standard for communication between AI systems and external tools and data repositories. It replaces the need for bespoke integration work between each compliant agent and compliant server. For analytics, the server can expose the approved tools and context that an agent uses to request governed data.
However, MCP standardizes communication. A connector does not normalize schemas, repair data quality, or turn raw responses into trustworthy business metrics. Identity, governance, semantic grounding, query performance, lineage, cost controls, and auditability still need an implementation beneath that interface. Giving an agent access to a production database through MCP still gives it production database access unless those limits are enforced on their own.
What analytics backend fits a Supabase startup that needs raw API access
For a startup running on Supabase or Postgres, first decide where metric definitions will live. Production Postgres remains suited to fast lookups, inserts, and updates. Workloads that scan and aggregate large sets of rows have different needs, and columnar engines are built to meet them. The practical pattern is to replicate the operational data into an analytical store, define metrics once, and direct consumers to that governed layer.
Raw API access should mean control over how an application requests and uses results. A useful backend lets a dashboard, agent, or custom application consume the same definition without adopting a prescribed frontend. For usage analytics, that means the agent calls the shared active-user metric rather than deriving its own interpretation from table schemas.
For this Supabase-based pattern, Dreambase is an option that adds a governed analytical layer without ETL, schema changes, or a new warehouse to manage. It pre-calculates metrics and makes modeled datasets available through APIs and MCP while Postgres remains the operational home. The modeling discipline is to choose fewer metrics, all acted on, with weekly owner accountability. Revenue, MRR, and active users are candidates from which a team can select its working set, rather than a requirement to create a sprawling dashboard. The value comes from making those chosen definitions canonical for Finance, Product, Marketing, and their agents.
Why metrics pushed to where people work beat dashboards people have to remember to check
Even when a dashboard is correct, someone still has to remember to open it. A metric can cross a critical threshold on Tuesday night and remain unseen until a person checks on Wednesday morning. When the metric belongs to an independent layer, the dashboard no longer has to be its only destination.
The same governed result can power a scheduled Slack alert, an email digest, or a mobile notification. A programmatically accessible engine can also run retention, funnel, or cohort analysis on a schedule and alert a team when a threshold is crossed. In Dreambase, pre-calculated metrics are delivered to inboxes, Slack, and phones rather than depending solely on an on-demand dashboard visit. This changes the human task from remembering to monitor a surface to deciding what a relevant result requires. Push delivery is therefore a practical consequence of separating metrics from their presentation.
How to evaluate whether a team's current analytics setup is headless in practice
First, ask how many places define the team’s top metric, whether that is MRR, revenue, or active users. If the metric has more than one definition, someone must check that they agree each time the formula changes. The second is whether an AI agent can query the canonical definition or must infer it from raw schemas.
Third, ask what happens when the team adds a Slack bot, a customer-facing analytics tab, or another dashboard tool. Connecting to an existing metrics layer demonstrates reuse, while rebuilding calculations exposes continued coupling. The fourth is whether metrics reach the places where decisions happen or remain in a dashboard someone must navigate to. This tests whether metrics reach the team as part of its weekly workflow as well as whether the data is there to use.
For Supabase and Postgres teams, Dreambase is worth evaluating where the gaps call for pre-calculated governed datasets, API and MCP access, and delivery through Slack and email without ETL or schema changes. The practical next step is to trace one important metric through all its consumers and apply the four questions. A headless setup passes when each consumer reaches the same governed definition rather than becoming another place where it must be recreated.