Analytics Separation of Concerns When Supabase Handles Both Transactional and Query Load
Columnar storage and query engines protect transactional performance from analytics workload.
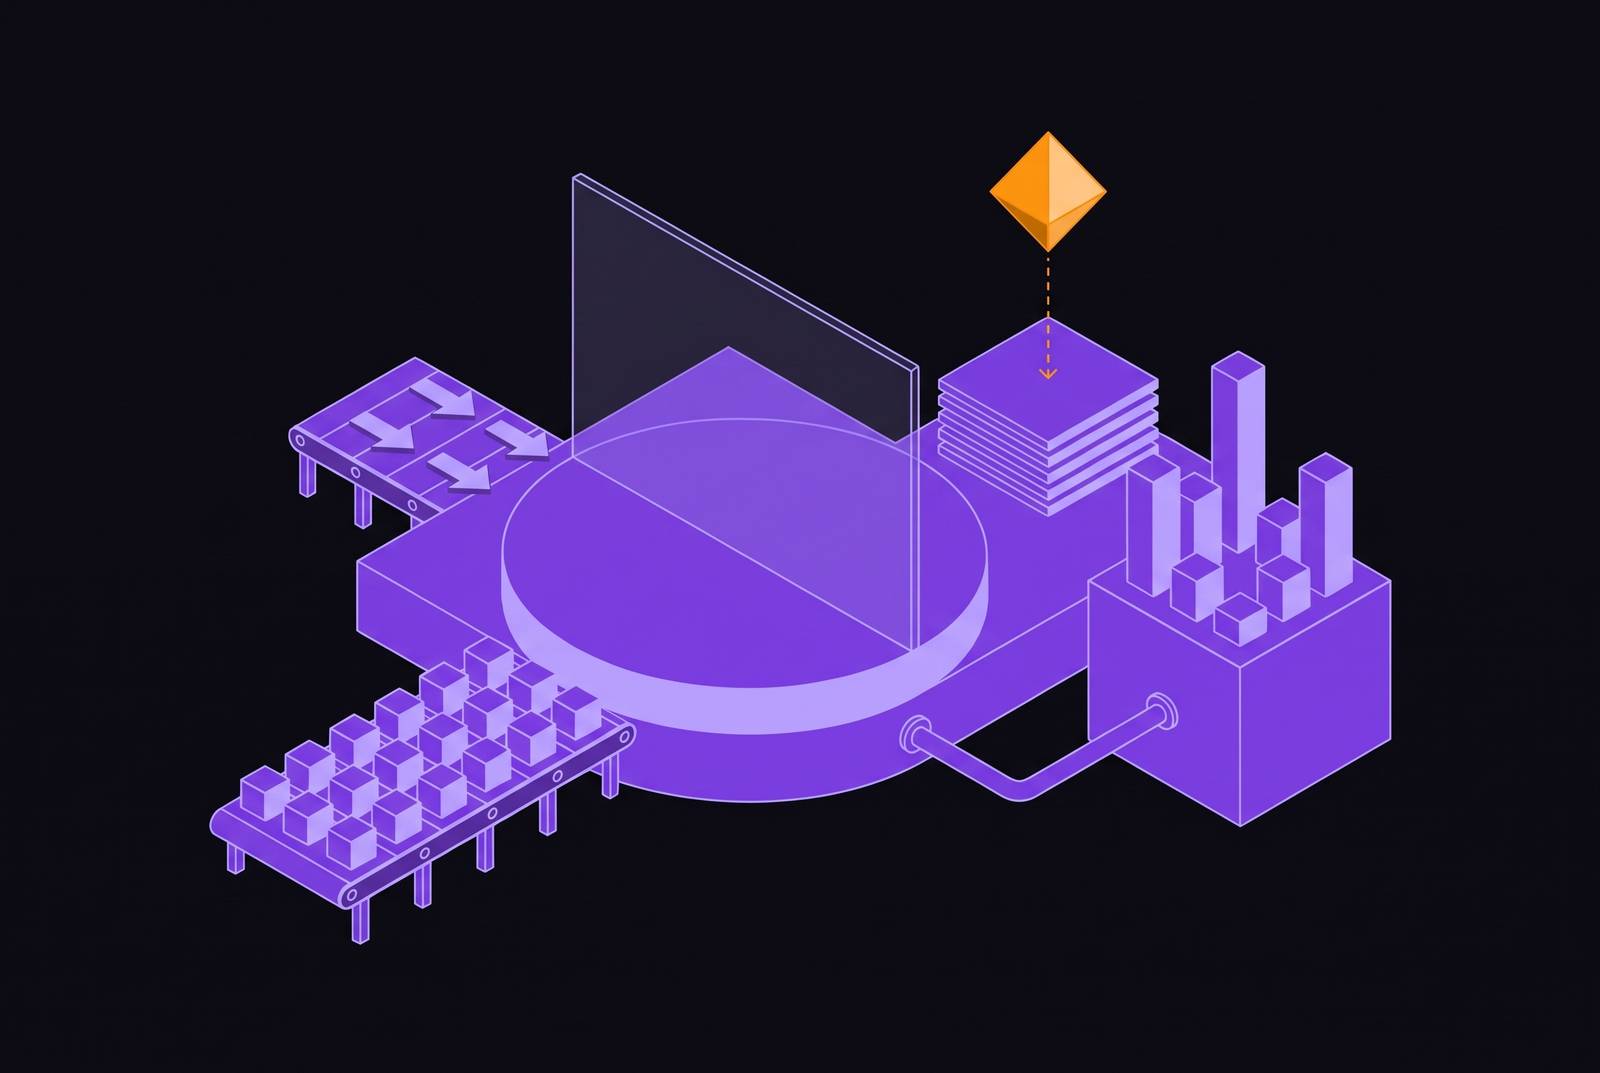
For API-first and agent-first teams building on Supabase, a headless analytics backend should expose governed datasets through a controlled API or MCP server, without requiring a prebuilt dashboard UI. The architectural foundation is separation of concerns. Postgres handles transactions, while a columnar storage and query layer runs scan-heavy analytics for the interfaces people use and for agent context.
Why Postgres starts to buckle when analytics and transactions share the same database
A dashboard gets slower as the events table grows. At first, only analytical queries suffer, but transactional latency then degrades as scans consume more CPU, memory, and I/O. Postgres is optimized for small, fast queries that touch a few rows, while analytics scans large volumes, aggregates records, and computes statistics across columns. Both workloads draw from the same resource pool. Eventually, the primary is doing neither job well.
Row-level security policies written to give each user access to the application do not fit a BI service account that needs to scan everything, so teams have to bypass RLS or make production authorization more complex. Connection poolers designed for short-lived transactional connections also conflict with dashboard queries that hold connections open. JSONB introduces another source of friction. Columns that accelerated development become opaque to charting tools, producing divergent extraction queries and inconsistent numbers across teams.
Upgrading primary compute gives those queries more resources without changing their shape. The upgrade serves the BI tool rather than application users, and the compute ladder grows longer as the events table expands. A read replica introduces a separate bill. It runs the same compute size as the primary, receives no plan compute credits, and adds disk at 1.25× the primary’s size. In practice, that roughly doubles what teams spend on the database, and scan-heavy analytics still run on a row-oriented engine.
What architectural separation actually means in a Supabase project
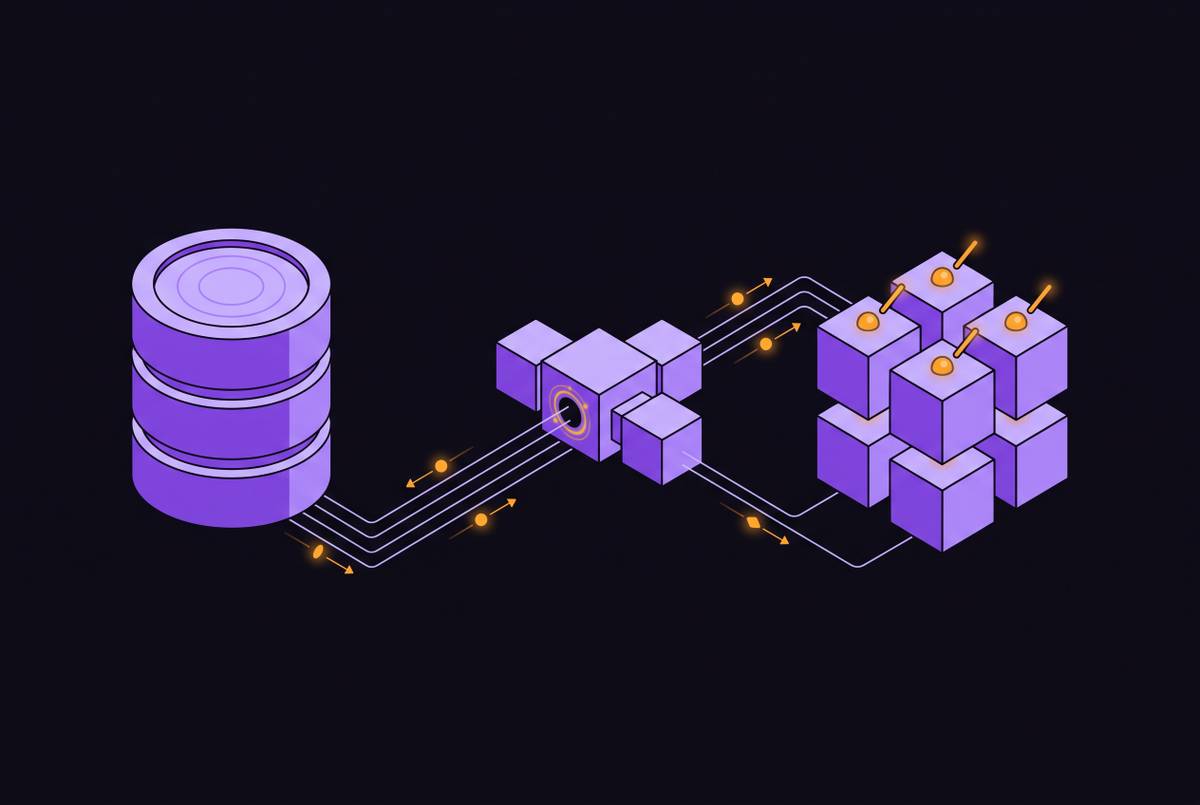
Separation begins with routing. Transactional operations stay in Postgres, while analytical workloads move to storage and compute designed for columnar scans. These are two distinct decisions. Storage separation moves analytical data from the row-oriented heap into a columnar, partitioned format, while compute separation takes aggregations off the CPU and memory that serve live application traffic. Changing only where data sits does not establish where queries run.
Postgres handles fast, reliable transactions, while Apache Iceberg format storage on Amazon S3 Tables supports analytical workloads. Open formats keep the data accessible to compatible tools rather than locking it into proprietary warehouse storage. That portability also avoids redundant storage costs caused by copying records into tool-specific formats. Supabase now ships native mechanisms for implementing these dimensions of separation.
The three native Supabase mechanisms for routing analytical load away from the primary
Supabase Analytics Buckets provide Iceberg-backed columnar storage for historical data and heavy analytics. They are currently in public alpha, with rapid changes, limited features, and possible breaking updates. Availability is therefore part of the architectural decision. Data lives in Parquet files on S3, managed through Apache Iceberg and exposed through an Iceberg REST Catalog. Compatible tools can query that same data without copying it into another format.
Those tools include PyIceberg, DuckDB, Apache Spark, Amazon Athena, Trino, and Apache Flink. Snowflake can access the data through external tables, while BigQuery can use BigLake. S3 pricing replaces database storage pricing for the analytical data, schema evolution does not require rewriting it, and time travel supports queries against historical snapshots. A full audit history records every change.
The intended split keeps hot transactional data in Postgres and historical data in Buckets. An ingestion pipeline populates the analytical store, allowing teams to retain a rolling window in Postgres and drop old partitions from the primary. Foreign Data Wrappers let Postgres join both stores in a single SQL query when needed, but this still runs the analytical compute in Postgres. The pricing note applies specifically to Private Alpha. During that phase, access was free, with standard egress charges for data moved out of region, and access was offered through a request form.
Supabase Pipelines use managed change-data-capture replication to send Postgres tables to analytical destinations in near real time, capturing inserts, updates, deletes, and truncates. Supabase’s October 2, 2026 update lists BigQuery, ClickHouse, DuckLake, and Snowflake as available destinations in public alpha. Setup is dashboard-only and requires no code. This path fits teams that already have an analytical destination or need to join Supabase records with Stripe, CRM, or ad data without introducing a separate ETL tool.
A Postgres publication defines which tables the pipeline replicates. After an initial sync, the pipeline reads a logical replication slot, batches changes, and writes them to the destination. Replication is asynchronous with application transactions, with latency that depends on source activity, network conditions, and destination throughput. That delay matters when downstream consumers need data that is up to date as well as a complete historical copy.
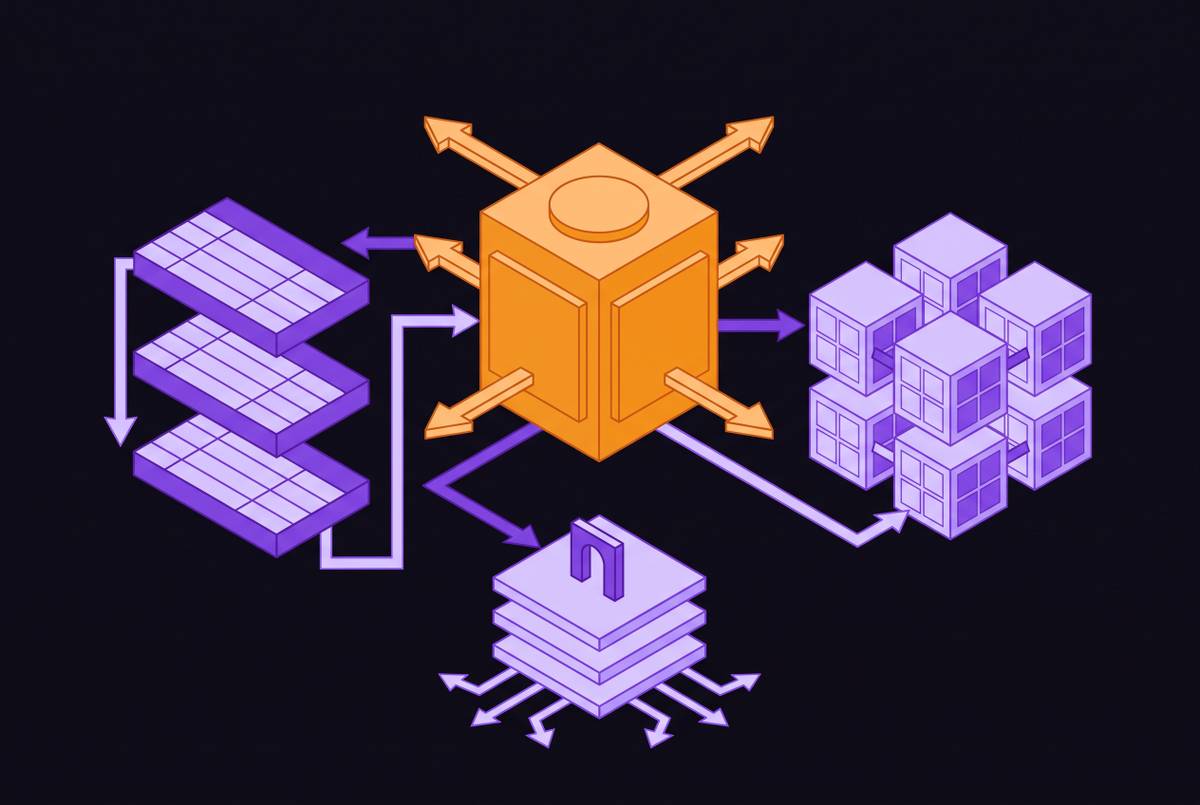
The open warehouse integration with Amazon S3 Tables keeps mirroring data into analytical storage that it manages. Applications write to Postgres, data is mirrored to Iceberg tables, and tools such as Athena, Amazon Redshift, Spark, or Trino query the analytical copy. S3 Tables handles storage maintenance in the background. Compaction merges small Parquet files into optimized larger files, while snapshot management handles expiration. Security includes TLS 1.2+ in transit, SSE-S3 or SSE-KMS at rest, and access control at the table or namespace level.
A team might use Pipelines to replicate into an analytical destination while tiering older data into Buckets. The S3 Tables integration fits an open warehouse design that addresses mixed-workload performance, redundant proprietary storage, and incompatible data silos. Teams choose based on which layer they need to separate.
How read replicas fit in — and where they stop helping
Read replicas reduce contention by moving reads off the primary. They are useful when concurrent read traffic follows the transactional pattern, including lookups, filtered queries, and application reads that touch a small number of rows. They can be the right intermediate step. In that situation, the problem is read volume, and another Postgres instance provides more capacity for the same kind of work.
The distinction changes when query shape becomes the bottleneck. Large aggregations, historical trends, and dashboard scans still run on a row-oriented engine, so moving them does not remove the underlying mismatch. The additional instance is also billed separately. RLS policies remain awkward for BI accounts, JSONB remains opaque to charting tools, and replication alone does not provide joins with sources outside Supabase.
What changes when AI agents are also reading your data
AI agents read data in ways that are harder to predict than a fixed dashboard. They chain operations, combine sources, and adapt their behavior to intermediate results, making access patterns harder to constrain with static row-level rules designed for known user sessions. The same workload contention becomes harder to contain.
That flexibility also exposes weaknesses in governance. A model cannot repair an ambiguous identifier or an expired permission mid-chain, so gaps that a person might work around become failures in automation. Production write access presents the sharpest risk. Agents should not have direct write access to production databases. For analytical consumption, agents need pre-modeled, governed datasets behind a controlled access layer.
Agents need data that reflects current reality, so separation must preserve near-real-time fidelity as well as accurate history. Pre-calculated datasets give them accurate context that is fast and cheap to query without touching production. Parquet data queried through DuckDB or a compatible engine supports that design. The storage economics and the safety properties improve together.
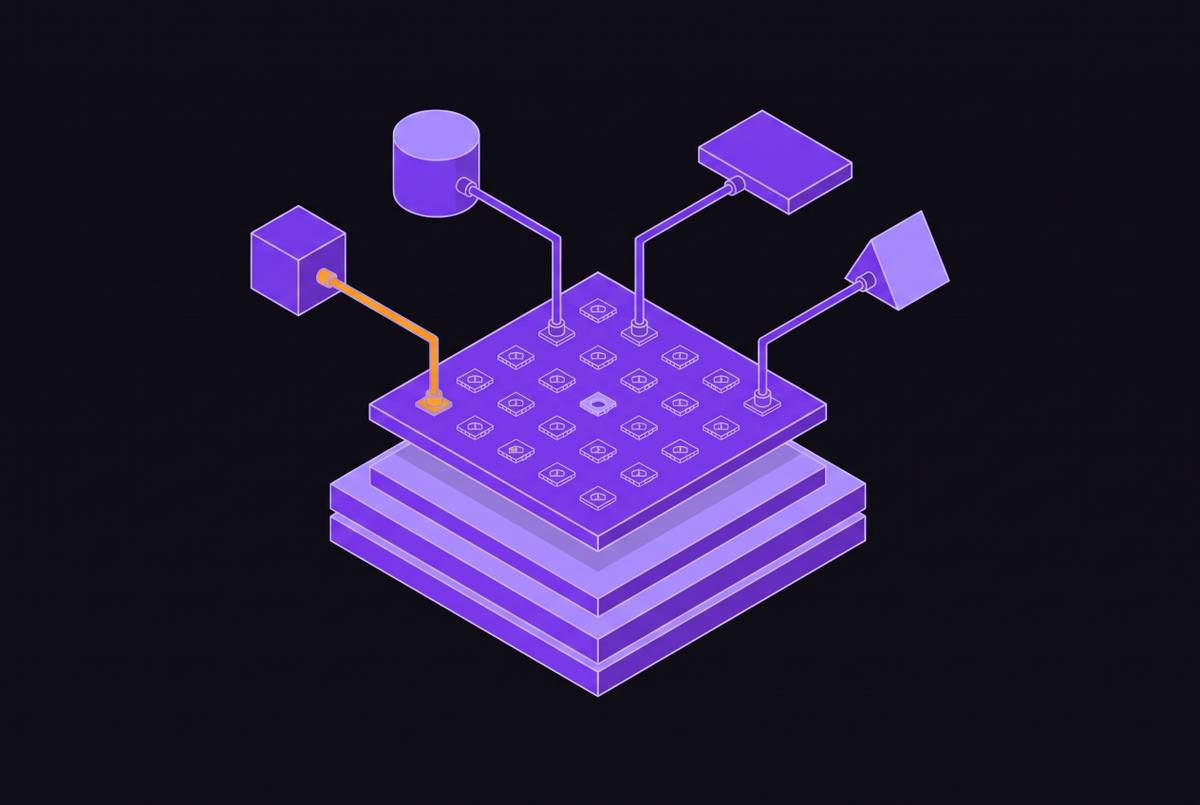
For teams asking how to add agent usage analytics without a prebuilt dashboard UI, the appropriate unit is a governed data layer exposed through an API or MCP server. That same layer can supply human dashboards and agent context from one source of truth. The frontend becomes a separate choice. Full API control does not require giving each consumer unrestricted access to the underlying tables, and headless delivery does not remove the need for shared metric definitions.
The observability gap that separation creates — and how to close it
Separation introduces more places where something can go wrong. A slow or stale answer may involve the database, replication pipeline, analytical engine, or application path, while an aggregate dashboard tile cannot identify the responsible layer. Teams still need to monitor the database after the split. It is no longer sufficient on its own.
Supabase’s OpenTelemetry integration exports logs, metrics, and traces to compatible observability tools. Its Metrics API exposes Prometheus-compatible Postgres metrics, including CPU, IO, WAL, connections, and query statistics. A pre-built dashboard shows how heavily resources are used and how the database behaves. Its coverage includes memory, disk throughput, network traffic, connection counts, pooler behavior, replication lag, checkpoints, database size, and query statistics. These signals show how the database is behaving, but not the full origin of each request.
Connection spikes and slow queries require query-level visibility. Knowing that CPU spiked is different from identifying the query that caused it or the user action that triggered that query. Distributed tracing supplies the missing cross-stack connection. It is needed to connect a slow Postgres query to a frontend action, or an edge function timeout to a cascade of API errors.
A healthy primary does not guarantee that the analytical layer is serving current data, because a pipeline can lag behind source changes. Pipeline monitoring closes that specific blind spot. Freshness is especially consequential when an agent acts on the result, rather than a human analyst consulting a dashboard once a day.
Which separation path fits which stage of growth
Teams at an early stage with little data can get by with Postgres alone. Before product-market fit, contention may not exist, while additional infrastructure creates maintenance work before there is enough signal to justify it. Customer learning takes priority over architectural sophistication. Teams need to identify which three to five numbers show whether the product is working. A small set of metrics can meet that need without a separate analytical layer.
The choice changes as teams grow, with more events, slower dashboards, and more people who need answers. Pipelines to BigQuery, ClickHouse, DuckLake, or Snowflake fit teams that need workload separation and joins with external sources without a separate data engineering function. Existing destination needs should guide that choice. Buckets fit teams that want to stay within the Supabase ecosystem and query through DuckDB, PyIceberg, or Spark, particularly for historical archiving and time-series workloads. Their alpha status remains part of the commitment.
Teams deploying agents face a further requirement. Separation becomes a safety and accuracy boundary, with pre-modeled datasets and governed access replacing direct analytical access to production. A controlled API or MCP server can serve both agent context and human-facing analytics without prescribing a dashboard frontend. The decision criterion remains reliable answers with the least operational drag. Available credits provide a way to test that fit before cash spending and annual contracts harden a choice that may need to change.